
Tuesday, 8:47am
8 February 2011
The numbers man
Nicholas Felton talks to Eye about the allure of data-driven storytelling

As he reaches the final stages of his latest Annual Report, Nicholas Felton finds time to give Eye magazine an exclusive interview, writes Alexander Ecob.
Rising to prominence with his 2005 Annual Report, Felton has – alongside his commisioned work – continued to farm himself as a source for his yearly personal project, and with a new app, has hopes that the rest of us will follow suit.
Above: from Feltron Annual Report 2010, about the life of Felton’s late father, Gordon.
AE: This latest Annual Report (2010) will be your sixth. What keeps you returning to the project?
NF: I feel that the world of self-tracking is immensely fertile, and I keep finding new approaches and significance within it.
In my search for content to use, I realised that the narrative of my life was the one that I had the most access to. I played with travelogues and time-lapse photography, but it wasn’t until I created this Annual Report format that I found an enthusiastic audience.
Above: from Feltron Annual Report 2007.
Above: from Feltron Annual Report 2009
What is it about the report format that appeals to people so much?
It’s obsessive and rigorous, which helps to strengthen its believability. It’s voyeuristic - but more importantly, I like to think of it as a mirror. I hope that when people read my reports, they reflect on their year, their travel or wonder about the best grilled cheese sandwich they had.
My first experiments were archeological; digging into the records that I found myself keeping naturally, and I was able to extrapolate them or tie them to other sources to tell a story I found amusing or satisfying. I moved on to self-tracking with the purpose of collecting content for my project.
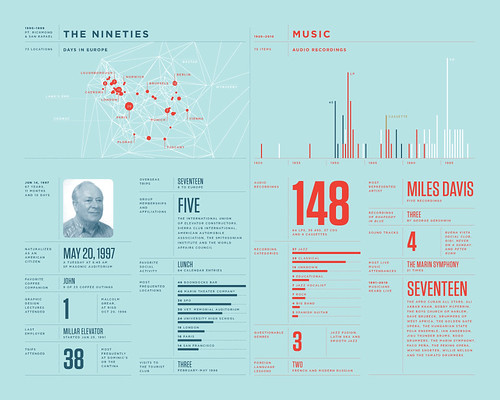
With this year’s report, I have come full circle. My father passed away in September, and I am back to digging through calendars and records to put together the pieces of his life. I am doing forensic work to try and identify locations of temples in Mexico that he has slides of, or clocktowers in Oslo.
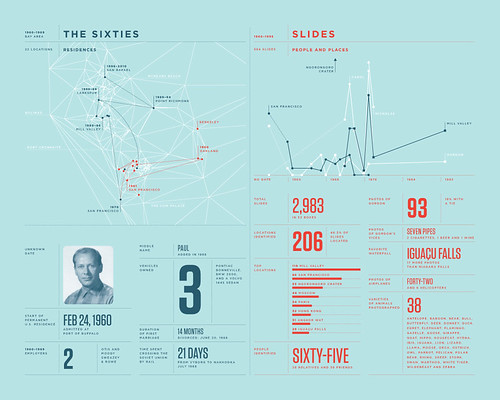
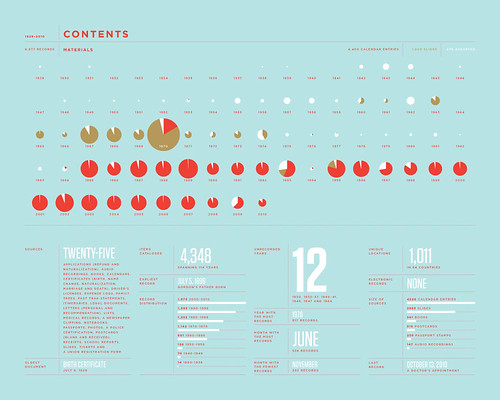
Above: from Feltron Annual Report 2010.
You’ve also released a Web app. In what way does this follow on from your reports?
The idea behind Daytum is to democratise the techniques I have been using. We have lowered the barriers for collection and elevated the quality of quantitative displays so that our users can focus on clever curation to communicate their stories. I think that there is an unserved population that wishes to share their experience, and I hope that the tool we have created can help them discover and express themselves.
Does the sterility of quantitative data not provide a barrier to storytelling?
That’s a great question. I would ask (and wonder myself), is your favorite song one that you hold in your head as your favourite, or the one that you have listened to the most? Are they the same? My guess is that they probably aren’t. I think that using this quantitative approach can provide more nuanced portraits of people and behaviour than the way we might describe ourselves.
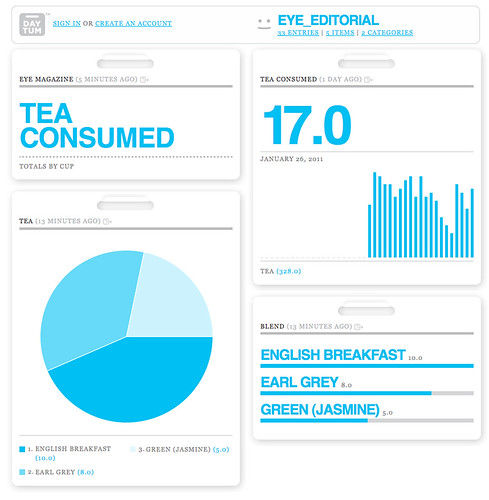
Above: Feltron’s Web-app Daytum, applied to tea-drinking.
Yes, I think there are parts of the human story that are incredibly difficult to capture with this approach, but I am interested in bringing the advantages of data to personal narratives. If I can identify a statistic that inspires wonder or amusement, or triggers memories, then I think I am starting to work in a very human realm.
At the highest level, my work is concerned with capturing and communicating stories. I think that there’s a massive storytelling potential in quantitative information, and that’s my pursuit.
See The 2010 Feltron Annual Report on Felton’s own website, feltron.com.
Eye, the international review of graphic design, is published quarterly for professional designers and students. It’s available from all good design bookshops and online at the Eye shop, where you can buy subscriptions and single copies. For a taste of 78, which includes several big features about information design, see Eye before you buy on Issuu, or the contents.